We've again had our annual July reminder of just how swiftly time passes, gold's trading volume having moved from the August contract into that for December. And for those of you lucky enough to be scoring at home, did you note the amount of contract premium built into December over August? Eight points (!), August gold settling Friday at 1350, but December's at 1358.
Short of enlisting a gaggle of summer interns to comb back through decades of contract data, said leap in premium is the largest in this writer's memory: typically, the difference in pricing from one "front month" contract to the next is a few points, in either direction; for example a year ago, the premium of December over August was less than four points.
But the willingness to pay $8/oz. more for gold due five months from now -- or conversely when you can lock in a price for $8/oz. less today -- seems a bullishly-biased indication of traders and gold hedgers' expectations.
So: we may already be tradin' December gold, but having only made it though July, here are our seven months year-to-date standings of the BEGOS Markets, with silver and gold leading the fold:
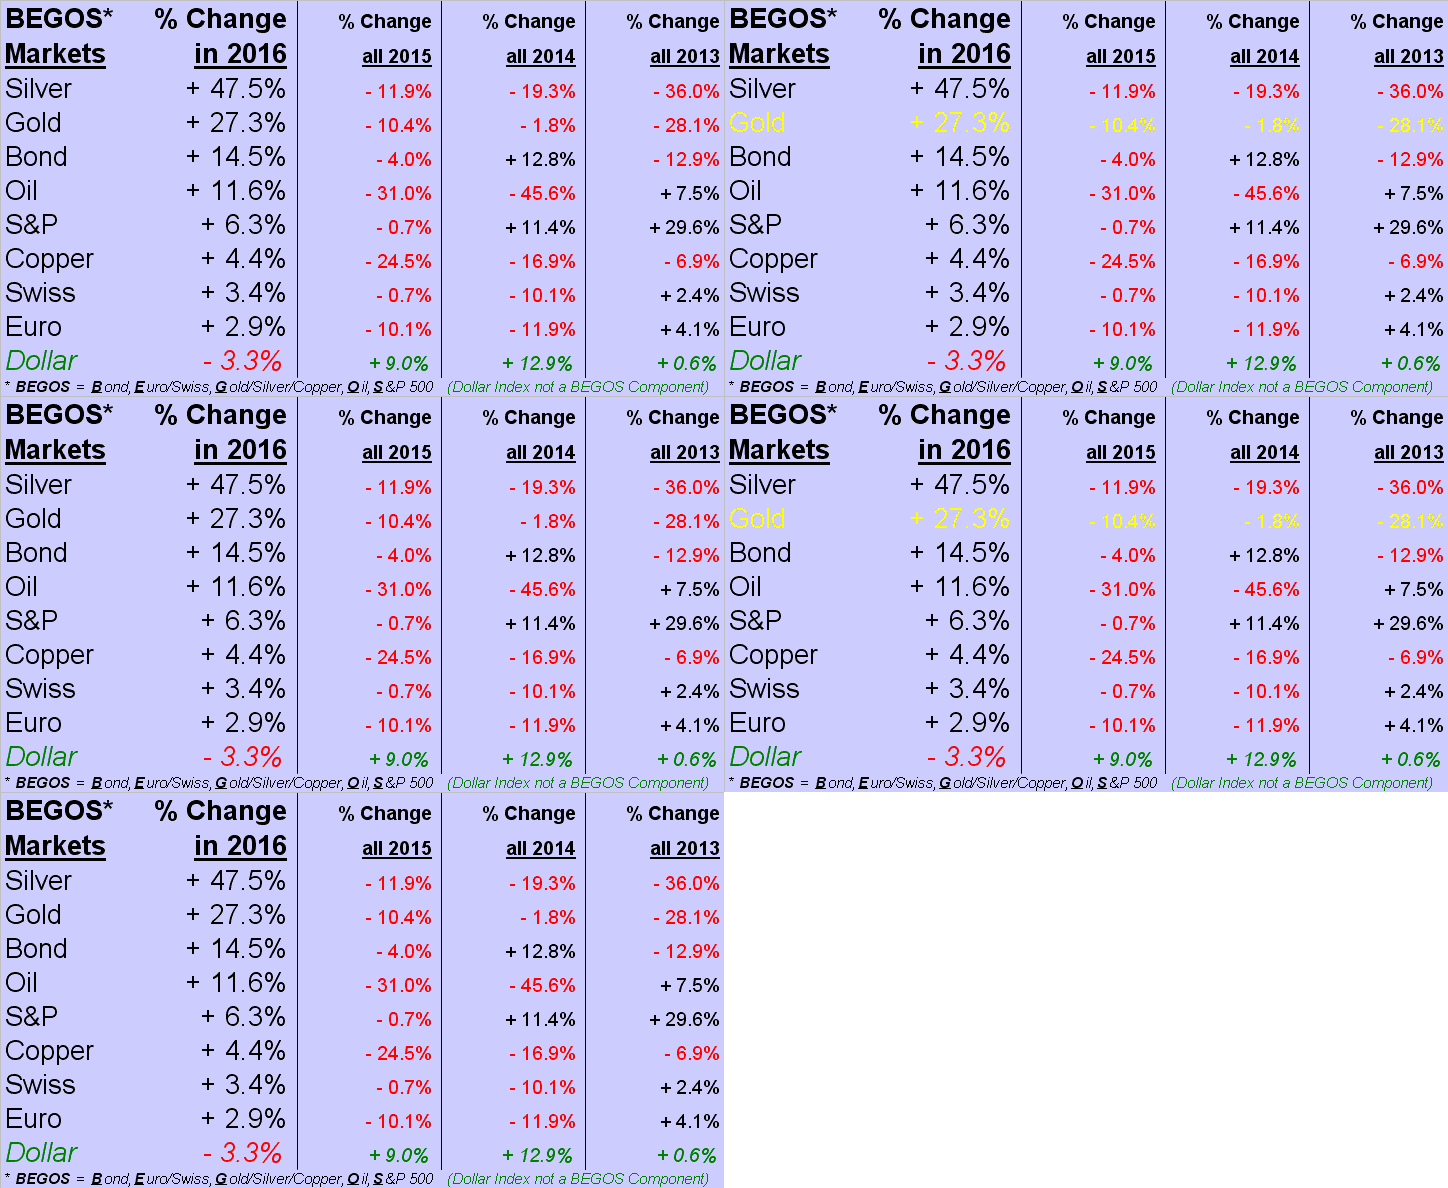
And on the heels of the Bank of Japan Friday announcing an increase to its stimulus policy, but at an "unexpectedly" understated pace, the dollar was sufficiently clobbered on Friday for its 3rd worst daily loss of the year, such as to send the yen and every component of the eight BEGOS Markets into a robust, upside finale in closing out the week.
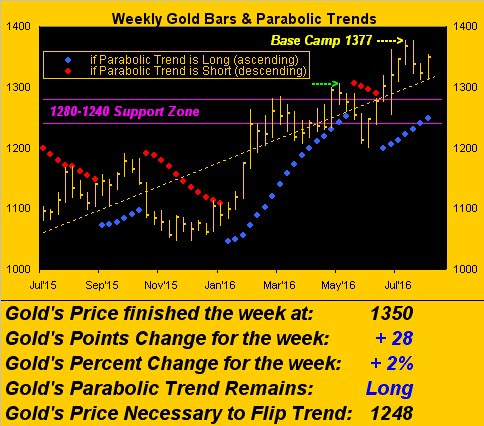
Add in the fact that the Q2 StateSide annualized Gross Domestic Product growth was the dud we thought 'twould be, (despite any "aid" from it being an election year), and 'twas nothing but GO! for gold as we below see per the weekly bars, (again the wee green arrow suggesting trading support at 1306):
Specific to the lackluster 1.2% growth rate from Q2 GDP, if you've been following the Economic Barometer, 'twas fairly obvious that the expectation for a 2.6% pace was rather a pipe dream. In fact, we've placed a linear regression trend line across the Econ Baro as next shown. A bit of a declination, don't you know?
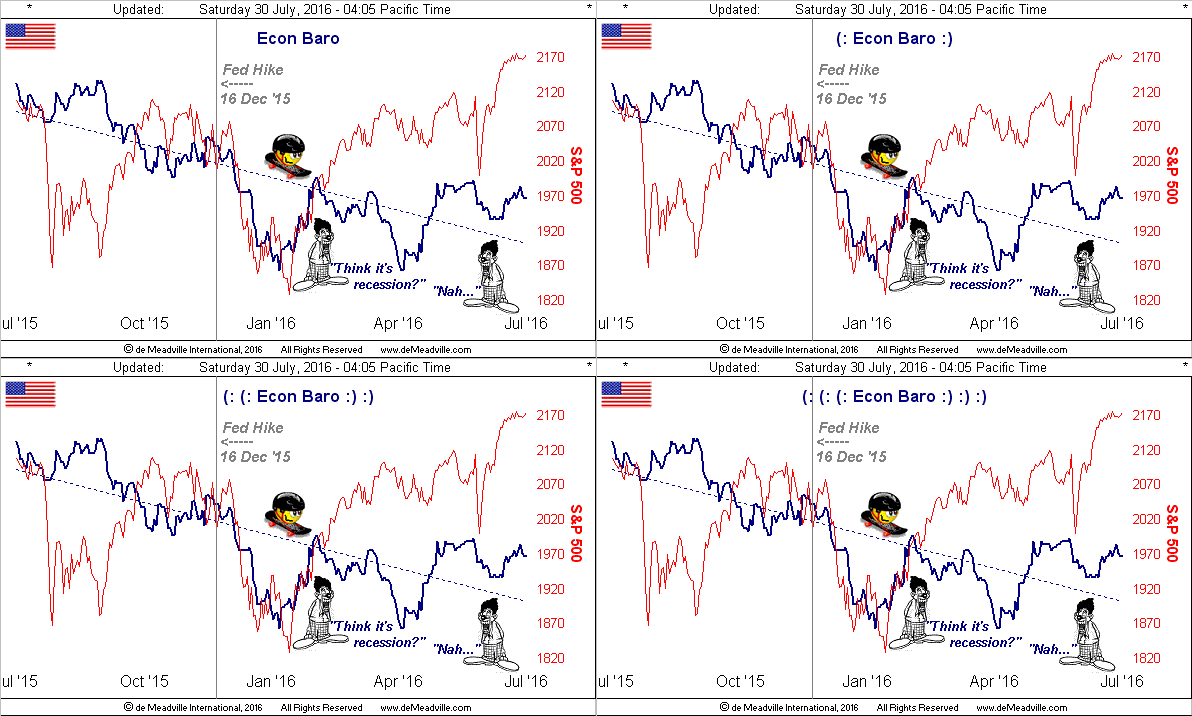
Yet Friday, San Francisco Federal Reserve Bank President John Williams said the U.S. economy "is doing well" such that he's not concerned about a recession. To quote Alice: "Curiouser and curiouser", for if we contextually take the declining trendline for the above Baro in tandem with the economic assessment of our own Fed Head, we delicately point out that this past Tuesday, the SAMHSA (Substance Abuse and Mental Health Services Administration) reported that over 15 percent of San Franciscans used cannabis in the last month, (purportedly per the Washington Post, "the highest rate in the country"). A pipe dream indeed? Go ask Alice.
Moreover, is it not interesting that toward figuring out the Fed, we hear 'tis all about when they shall "hike", rather than when they shall "move"? Yes, there is a difference. And yesterday's celebration across all eight BEGOS components -- a quite rare occurrence -- seems stimulus suggestive to us.
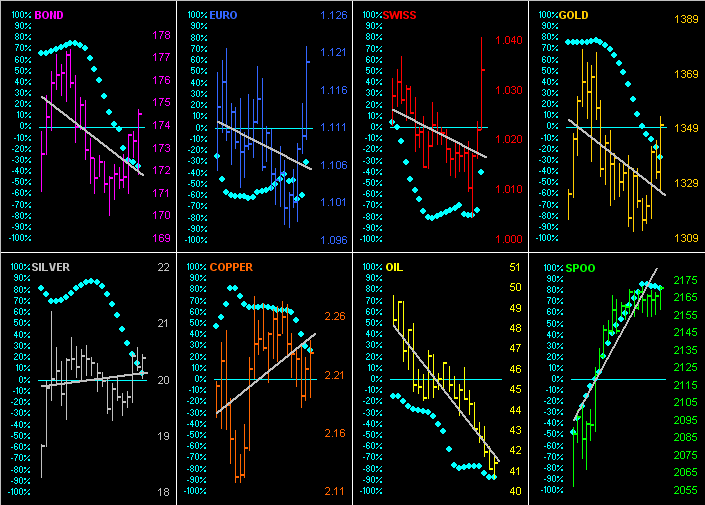
Here below for the entire bunch are their last 21 trading days (one month), the rightmost bar in each panel being yesterday's up-for-all session, along with the diagonal linear regression trendlines and "Baby Blues" as day-by-day readings of trend consistency. (The "Spoo" is the unable-to-correct S&P 500 futures market):
And speaking of the S&P, according to its just-issued Foreign Sales Report, the percentage of products and services produced or sold by S&P 500 companies outside the U.S. during 2015 (44.3%) was the lowest since 2006 (43.6%).
Yet in spite of the European sales percentage actually having increased last year, representative of the EuroEconomy today, Deutsche Bank (DE:DBKGn, NYSE:DB) just reported a 20% quarterly drop in revenues, given the challenges of low interest rates and volatile markets.
The FinTimes chimed in as well with "Eurozone recovery loses momentum ... Data cast doubt on strength of revival as French economy grinds to halt". Elsewhere, the S&P's 2015 percentage measures decreased from sales in Asia, Canada and Africa.
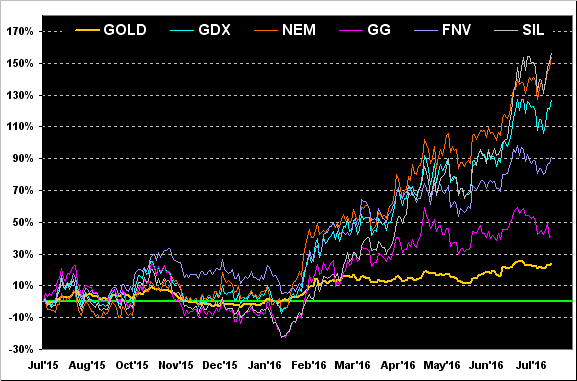
'Course, where percentage measures have done exceptionally well are in precious metals and obviously their equity kin. So with another month now in the books, 'tis time to bring up -- the operative word there being "UP" -- the year-over-year percentage tracks of gold +24%, Goldcorp Inc (NYSE:GG) +41%, Franco-Nevada Corporation (TO:FNV) +91%, VanEck Vectors Gold Miners (NYSE:GDX) (the prominent exchange-traded fund of the gold miners) +127%, Newmont Mining Corporation (NYSE:NEM) +154%, and Global X Silver Miners (NYSE:SIL) (the popular exchange-traded fund of the silver miners) +157%.
GG's lagging the equities bunch, per a quarterly earnings loss, is given due to a short-term slowing in production whilst management ramps up its structural reorganizing: nice to be able to do that with gold under your feet rather than paper, non? Here's the graphic:
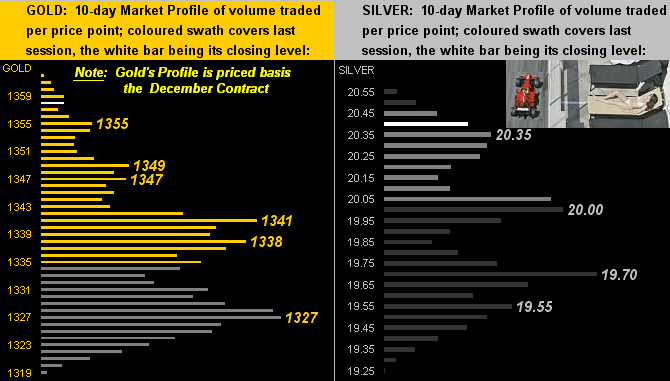
Next we go near-term to the Precious Metals' 10-day Market Profiles. Nothing like swinging from low-to-high in just a week's time, eh? Noted therein, gold's profile on the left is price-adjusted to the December contract, as 'tis where you traders ought now be, (unless you're planning to take or make delivery on those August contracts to which you may be obligated: "First Notice" for August was yesterday). For Sister Silver on the right, 'tis as if she's sunbathing atop the terrace at Monaco's Thermes Marins. And in being up 47.5% year-to-date, clearly she is the white hot metal:
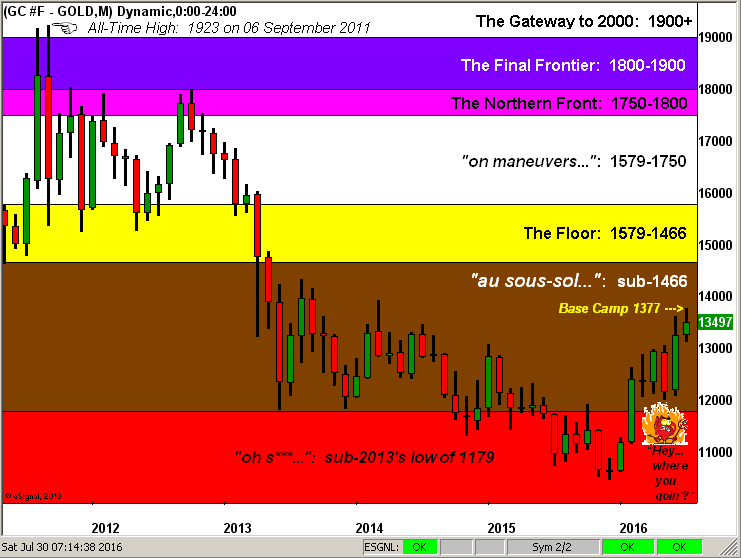
Finally, with the yellow metal having completed another monthly bar, here is the updated, broad-based Gold Structure, with our long-running key trading zones. The biggest area upon which we're focused for the balance of the year, if not imminently so, is Base Camp 1377, (our revised high for the year upon gold having cleared 1280 for better than a week in early July), and indeed, 1377 is the precise high year-to-date.
Come the next test of 1377, we expect a Bataille Royale betwixt the Ardent Believers and the Algorithmic Bots: the former attempting to push price up out of the basement ("sous-sol") versus the latter selling into perceived resistance:
So as we peek into next week, 'tis one of those chock-full of incoming EconData for the EconBaro, the dénouement being what has essentially become the unpredictable amount of payroll creation/reduction. Either way, 'tis one of 18 metrics on deck to go into the Baro as the week unfolds, which at the website you can behold.
Lastly, we now "officially" know the two StateSide candidates who'll be vying to become the next so-called "leader of the free world." 'Tis argued in various parlours of communiqué across the land that one nominee is a troublemaker, the other a criminal, and moreover that 'twixt the two, said monikers are interchangeable. Regardless of which way you may be sold, the stronghold candidate is gold!